Image gallery
Visualisations

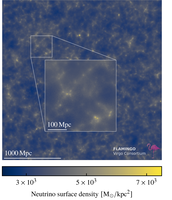
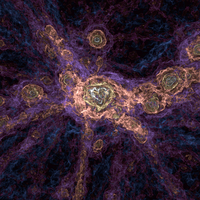
A projection through a 40 Mpc thick slice through the fiducial 2.8 Gpc run at z=0. The luminosity of the background image gives the CDM surface density whilst the colour encodes the surface density of massive neutrinos, both on a logarithmic scale. The insets show three consecutive zooms centred on the most massive halo; in order, these show the mass-weighted gas temperature along the line of sight, the CDM surface density, and the X-ray surface brightness in the 0.5-2 keV band (computed from the z=0 snapshot but placing the cluster at z=0.025). (Figure 1 from Schaye et al. 2023)

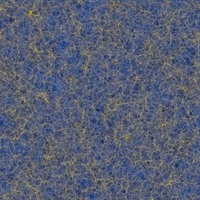
These panels show a 63x63x20 Mpc slice through the z=0 snapshot of the L1_m8, L1_m9 and L1_m10 simulations, respectively. From left to right the mass resolution decreases by consecutive factors of 8. The color coding shows the total (i.e. cold dark matter plus neutrinos plus gas plus stars) surface density on a logarithmic scale. The insets zoom into the indicated region and show more clearly that there is structure down to smaller scales in higher-resolution simulations. (Figure 6 from Schaye et al. 2023)

Full sky maps of the thermal Sunyaev-Zel'dovich effect as quantified by the Compton y parameter for different redshift intervals. The first three maps show the shells from z=0-0.05, z=0.05-0.1 and z=0.1-0.15, while the fourth one in the back shows a much larger redshift range, z=0.15-5.0, and hence gives higher values. The map on the bottom right shows the total integrated Compton y from z=0 to 5, i.e. the sum of the four maps shown above it. (Figure 7 of Schaye et al. 2023)


